Yesterday Bloom Energy reported a 165% surge in revenue, stemming from one problem: data centers need power, and grid interconnection queues are measured in years.
Vertiv (NYSE: VRT) is the other half of that equation - and it reported this morning too. But its report presents something more interesting than growth: an apparent contradiction between the top line and everything else.
About the Company: What Vertiv Actually Sells
Vertiv does not make chips and does not operate data centers. It sells what allows them to work: power supply, backup, and above all - heat management.
- Thermal management - cooling. This is the growth engine.
- Power and infrastructure - UPS systems, switchgear, distribution.
- Services - maintenance and support over the facility's life.
Why Cooling Became the Bottleneck
This is the point that explains the whole thesis, and it is simple physics.
An ordinary server consumes a certain amount of electricity, and most of it becomes heat. In a traditional data center, one rack draws a few tens of kilowatts - and air cooling suffices. Fans push cold air, the heat disperses, everything works.
A rack of AI processors draws many times more. And the heat generated in such a small volume reaches a density at which air simply cannot remove it fast enough.
And hence the move to liquid cooling
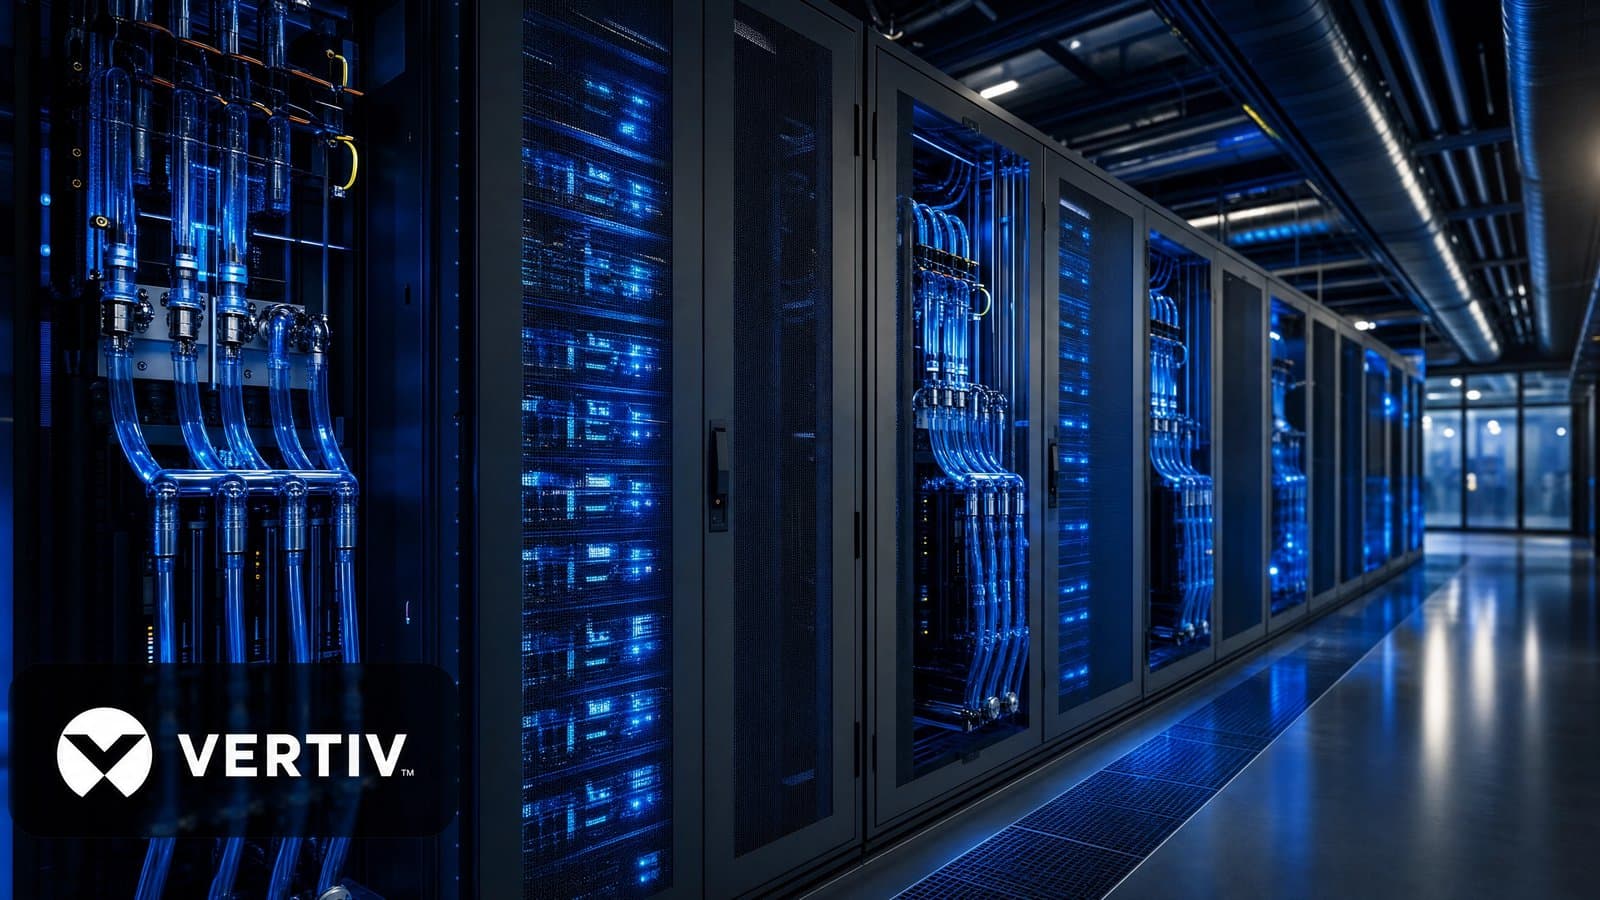
Water conducts heat by an order of magnitude better than air. When power density per rack passes a certain threshold, air cooling stops being a question of efficiency and becomes a question of feasibility - it simply cannot be done. The result: new data centers are moving to liquid cooling, with fluid piped directly to a plate attached to the chip. And this is a structural change, not an upgrade. Liquid cooling requires entirely different infrastructure: piping, pumps, heat exchangers, leak monitoring. Whoever sells that system enters a project early and stays in it for years. And note what that means for the thesis: it rests on a physical limit, not on a customer preference. Preferences change; physics does not.
What Was Reported - and the Apparent Contradiction
| Metric | Result | Change | Consensus |
|---|---|---|---|
| Net sales | $3,274 million | +24% | about $3,390 million |
| GAAP EPS | $1.27 | +53% | - |
| Adjusted EPS | $1.52 | +60% | $1.43 |
| Operating profit | $638 million | +44% | - |
| Adjusted operating profit | $738 million | +51% | - |
| Adjusted operating margin | 22.6% | +410 bps | - |
And here is the contradiction: revenue came in below consensus by about 3.4%, but adjusted EPS came in above consensus by nine cents - and above management's own guidance of $1.37-1.43.
The growth breakdown: of the 24% sales growth, 18% was organic, 5% from acquisitions and 1% from currency.
Why Revenue Missed - and Whether the Explanation Holds
The company attributes the gap to timing shifts: temporary supply-chain congestion, and multi-phased project execution as deployments scale in size and complexity.
And that is an explanation you can test, not just believe.
How to tell whether a timing delay is really a timing delay
When a company explains weak revenue with "timing," there are two possibilities: either the orders genuinely exist and execution slipped - or demand weakened and "timing" is the polite word for it. And the test is simple: what does it guide to for next quarter. A company losing demand does not raise guidance. A company that deferred shipments has to show them coming back. And in this case, the guidance answers clearly.
Guidance - and This Is the Decisive Figure
| Metric | Third quarter | Full year |
|---|---|---|
| Net sales | $3,650-3,850 million | $13,800-14,200 million |
| Organic growth | 34%-36% | 30%-32% |
| Adjusted operating profit | $898-938 million | $3,285-3,365 million |
| Adjusted operating margin | 24.0%-25.0% | 23.3%-24.3% |
| Adjusted EPS | $1.77-1.83 | $6.65-6.75 |
| Adjusted free cash flow | - | $2,400-2,600 million |
And two rows in this table determine how the whole report reads:
The first - organic growth. The reported quarter delivered 18%. Next quarter's guidance: 34%-36%. That is nearly a doubling of the pace. A company whose demand is weakening does not guide like that.
The second - full-year guidance was raised. Adjusted EPS rose from $6.30-6.40 to $6.65-6.75 - and revenue from $13.5-14.0 billion to $13.8-14.2 billion.
The Margin - and What Is Hidden In It
410 basis points of adjusted operating margin expansion is the least-discussed figure in the report, and perhaps the most meaningful.
The company attributes it to three factors: operational execution, continued strong productivity, and favorable price-cost - inclusive of tariff impacts and the countermeasures against them.
And that last point deserves attention. Tariffs are a headwind for any manufacturer importing components. A company that manages to expand its margin by 410 basis points despite tariffs is saying one thing: it is passing the cost to the customer. And that only happens when the customer has no convenient alternative.
Cash Flow - the Reversal
| Metric | Current quarter | Change |
|---|---|---|
| Operating cash flow | $1,100 million | +241% |
| Adjusted free cash flow | $925 million | +234% |
And the company ended the quarter in a net cash position - meaning cash exceeds debt.
That is significant for a fast-growing infrastructure company. Expanding capacity consumes capital, and normally a company growing at this pace burns cash on inventory and working capital. Free cash flow of $925 million in a quarter, alongside full-year guidance of $2.4-2.6 billion, says the growth is funding itself.
What the Report Does Not Give
Orders and backlog. In an infrastructure company these are the forward-looking measures - revenue describes completed projects, and backlog describes what has already been locked in for coming years.
The results announcement does not publish a numerical backlog figure. Management refers to strengthening pipelines, but without a number. Anyone who wants that figure will need the investor call and the full report.
The Link That Completes the Picture
| Layer | Company | What it reported |
|---|---|---|
| On-site power generation | Bloom Energy | Revenue +165% |
| Power distribution and cooling | Vertiv | Adjusted EPS +60%, margin 22.6% |
| Chip process control | KLA | Guidance jumping to $4 billion |
| Chip test | Teradyne | Revenue +104% |
| Storage | Seagate | Margin from 37% to 52% |
| Memory | SK hynix | 76% operating margin |
And all of these layers are reporting acceleration. This evening bring Microsoft and Meta - and those, unlike everyone above, are not the suppliers. They are the customers. They write the cheques that appear in these reports as revenue.
The Bull Thesis
Whoever reads it positively will point to a rare combination: adjusted EPS up 60%, a margin expanding 410 basis points, cash flow more than tripling, and a move to a net cash position.
Beyond that: guidance signals acceleration, not deceleration - 34%-36% organic growth next quarter against 18% this quarter. And management raised full-year guidance across every key metric.
And the positioning: every data center built - by any operator - needs power and cooling. There is no need to guess which model wins.
The Bear Thesis
Whoever reads it critically will note first that revenue missed consensus, and that the explanation - supply-chain congestion - will have to prove itself next quarter. If organic growth does not reach 34%, the explanation was wrong.
Second, dependence on the pace of investment. Revenue is derived almost entirely from new data-center construction. If the pace slows, orders will stop before revenue falls.
Third, the absence of a backlog figure in the announcement makes independent verification of demand strength harder.
And fourth, customer concentration and competition. A small number of hyperscalers account for a large share of demand, and cooling is not an exclusive field - there are large industrial-equipment players and server makers developing integrated solutions.
The debate in one line
The bulls see earnings up 60%, a margin expanding 410 basis points, cash flow tripling, a move to net cash and guidance that nearly doubles the organic growth rate. The bears see revenue below consensus, an explanation resting on timing, no backlog figure, and total dependence on the data-center construction wave continuing. Both sides are reading the same report.
My Angle
A personal opinion of Ilan Abramov - not advice, not a recommendation
What catches me in this report is how you test an explanation.
When a company explains weak revenue with "timing shifts," that is easy to say and hard to verify. It can be entirely true - or a polite name for demand that softened.
So I do not look at the explanation. I look at the guidance.
A company that deferred shipments has to show them coming back next quarter. A company that lost demand would not dare guide high. Vertiv guided to 34%-36% organic growth, against the 18% it just posted. That is not the guidance of someone hiding weakness. It is guidance that puts the explanation to a public test in three months.
And what reinforces it is the margin. 410 basis points of expansion, including managing tariff impacts. Tariffs raise component costs for every manufacturer. Whoever manages to expand margin despite that - is passing the cost to the customer. And that only happens when the customer has nowhere else to go.
And that is, to me, the central point of this whole thesis: it rests on physics. Above a certain power density, air cannot cool. That is not a preference that can change when fashion changes - it is a limit. Which is why every new chip generation, drawing more power, expands this market by itself.
And what I will follow: 34%. That is the number management put on the table. If next quarter reaches it - the timing explanation was real, and the miss was noise. If not - this was not a supply-chain problem, and it will be worth rereading this report in an entirely different light.
Summary
Vertiv delivered a quarter that requires reading on two levels. The top line disappointed: sales of $3,274 million (+24%) against consensus of about $3,390 million, because of what the company describes as timing shifts and temporary supply-chain congestion.
And everything else is strong: adjusted EPS of $1.52 (+60%) against a $1.43 estimate, an adjusted operating margin expanding to 22.6% (up 410 basis points), operating cash flow surging 241% to $1.1 billion, and a move to a net cash position.
And the decisive figure: third-quarter guidance calls for organic growth of 34%-36% - against 18% in the reported quarter - and full-year guidance was raised to adjusted EPS of $6.65-6.75.
The question for the investor is not whether demand exists - the guidance answers that - but whether the timing explanation holds up. And that has a date: next quarter.
Sources: Vertiv Holdings' official results announcement for the second quarter of 2026 (July 29, 2026), as filed with the U.S. Securities and Exchange Commission on Form 8-K, including sales and the growth breakdown, GAAP and adjusted earnings, operating profit and margin, cash flows, cash position and guidance for the third quarter and full year; the company's prior guidance and Zacks consensus ahead of the report. Data accurate as of the time of writing. The chart is shown in real time via TradingView. Nothing herein constitutes a forecast, recommendation or advice - see the full disclaimer at the bottom of the page.


