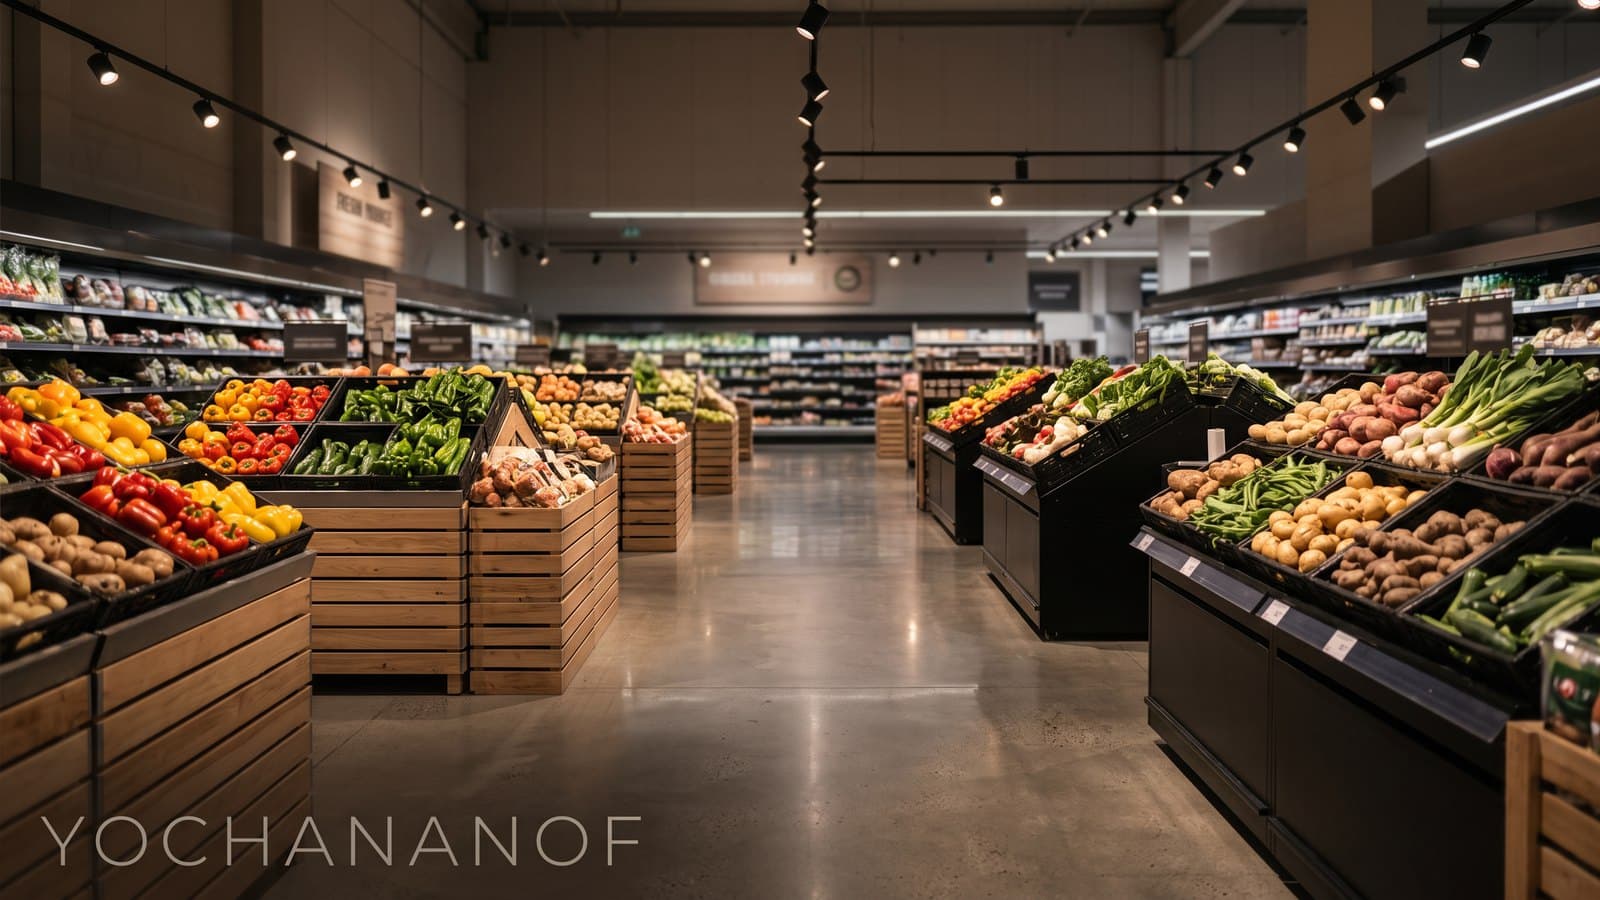
Yochananof published its second-quarter report. It is the only one of today's filers to have supplied the comparative period, and that makes it the most instructive of them all.
Errors or inaccuracies are possible. Spotted something that looks wrong? Write to me and I will correct it.
The Quarter, Against the Comparative
| NIS millions | The quarter | Comparative | Change |
|---|---|---|---|
| Revenue | 1,233.4 | 1,264.5 | -2.5% |
| Gross profit | 270.9 | 274.6 | -1.3% |
| Operating profit | 85.8 | 91.1 | -5.8% |
| Pre-tax profit | 64.4 | 71.5 | -9.9% |
| Net profit | 50.0 | 55.3 | -9.6% |
| Basic earnings per share | NIS 3.45 | NIS 3.75 | -8.0% |
| Balance sheet total | 4,361.4 | 4,393.2 | -0.7% |
| Shareholders' equity | 1,610.3 | 1,539.1 | +4.6% |
The Phenomenon: The Decline Amplifies on the Way Down
This is the most important line in the report, and it is not a single number but a sequence.
| The fall | |
|---|---|
| Revenue | -2.5% |
| Gross profit | -1.3% |
| Operating profit | -5.8% |
| Pre-tax profit | -9.9% |
| Net profit | -9.6% |
And this is precisely what operating leverage looks like when it runs in reverse.
A supermarket chain carries a cost base that does not move with turnover: store rent, electricity, staff on shift, head office. They exist whether or not shoppers came in.
So when revenue falls 2.5%, costs do not fall 2.5% - they fall less, or not at all. And the difference comes out of profit.
And because profit is far smaller than revenue, that same absolute difference is a far larger percentage of it. NIS 31 million less in sales is 2.5% of turnover - and NIS 5.3 million less in operating profit is 5.8% of it.
This is not a Yochananof phenomenon. It is the structure of any business with high fixed costs - and it is also why, in the opposite direction, small growth in turnover produces a large jump in profit.
And What Is Interesting: The Gross Margin Actually Improved
This is the point that makes the report less routine than it first appears.
| The quarter | Comparative | |
|---|---|---|
| Gross margin | 22.0% | 21.7% |
| Operating margin | 7.0% | 7.2% |
| Margin survival | 31.6% | 33.2% |
The gross margin rose by about a third of a percentage point. That is, on every shekel sold the company kept more after the cost of goods - an improvement in mix, in procurement or in pricing.
And the operating margin fell anyway.
The meaning is precise: what eroded is not on the buying and selling side of the goods. It is in the cost of running the chain - the part between gross profit and operating profit, which grew from 66.8% of gross profit to 68.4% of it.
And that is a useful separation: a report where the gross margin erodes tells you about price pressure or competition. A report where the gross margin improves and the operating margin erodes tells you about operating costs. Two different problems, and two different fixes.
And the Costs Below the Operating Line Grew Too
From NIS 85.8 million of operating profit, NIS 64.4 million was left before tax - NIS 21.3 million was taken out, which is 24.9%.
In the comparative period that share was 21.5%.
In retail, the bulk of this item is interest on lease liabilities. The leases standard presents store rent as a right-of-use asset and a liability, and the interest on it falls below the operating line.
So a chain that opens stores will see this item grow - even if rent per square metre has not changed at all.
The Balance Sheet: The Only Direction That Improved
| The quarter | Comparative | |
|---|---|---|
| Balance sheet total | 4,361.4 | 4,393.2 |
| Shareholders' equity | 1,610.3 | 1,539.1 |
| Leverage ratio | 2.71 | 2.85 |
Equity grew 4.6% while the balance sheet shrank 0.7%, and so the leverage ratio fell.
That is a positive development, and it comes from profit retained rather than distributed - the company still earns NIS 50 million a quarter.
הזווית שלי
דעה אישית של אילן אברמוב - לא ייעוץ ולא המלצה
What I value in this report is that it made the analysis possible at all.
Of all 40 Israeli filers today, Yochananof is the only one that supplied the comparative period in the structured file. And without that figure, all I could have written is "a gross margin of 22.0%" - a number that says nothing about whether that is good or bad.
With the comparative, that same number becomes an insight: the gross margin rose and the operating margin fell. That is a sentence you cannot write without two points in time.
And what I take about the business itself is that a 2.5% fall in turnover is not a drama, but it does not stay 2.5%. By the bottom line it had become 9.6%, and in a business with a 4.1% net margin there is not much room to absorb another year like it.
And what I will follow is not turnover but like-for-like sales. A fall in turnover can come from closing a store, and that is a decision; a fall in like-for-like is the consumer. Two entirely different things, and the structured filing does not separate them.
(It is important to stress: this is my personal opinion only, and nothing herein constitutes a recommendation to take any action.)


