MicroVision filed its second-quarter report on 6 August 2026, and we are writing about it today.
Errors or inaccuracies are possible. Spotted something that looks wrong? Write to me and I will correct it.
What the Company Does
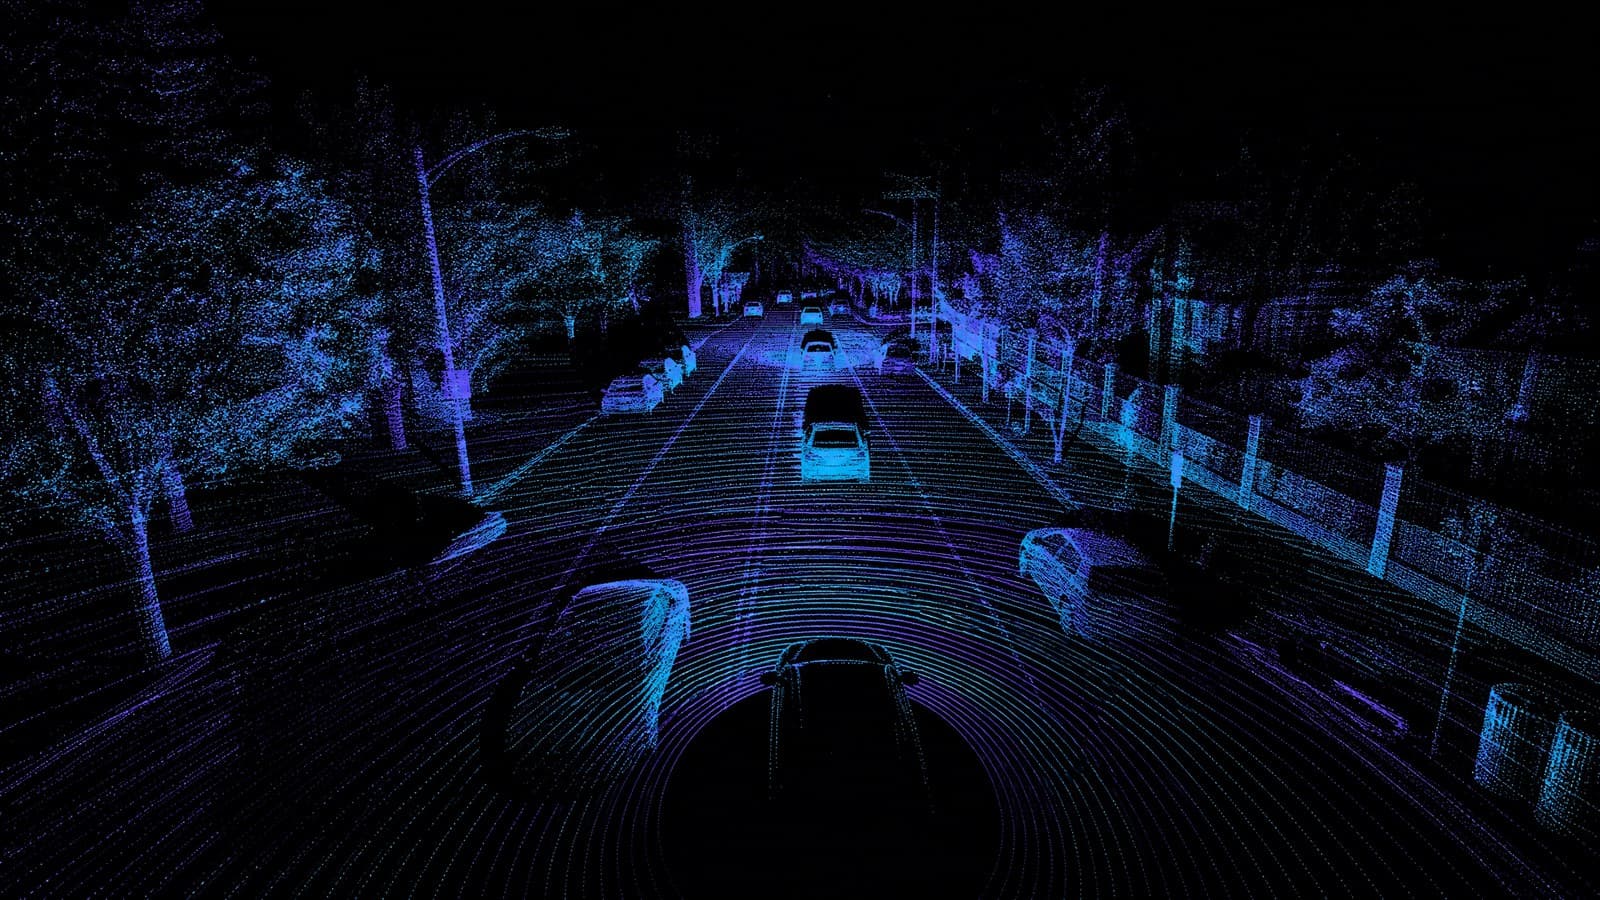
MicroVision sells lidar. Lidar is a sensor that fires pulses of laser light, measures how long the light takes to come back, and builds a three-dimensional map of the surroundings from that. A camera sees a picture. Lidar knows distance. That is why the industry wants it in vehicle safety systems, in autonomous driving, and in industrial machines that need to know what is in front of them.
The company does not build cars and does not operate them. It is trying to sell the sensor, and the software that interprets its data, to carmakers and to other industries. In the release the chief executive describes the strategy under the label Lidar 2.0.
One term to know before the table is ATM. It stands for at-the-market, a mechanism that lets a company sell newly issued shares directly into the market over time and receive cash for them. That is money coming into the treasury at the cost of diluting existing shareholders. We will come back to it.
The Quarter
| The quarter | A year ago | |
|---|---|---|
| Revenue | $1.473 million | $0.155 million |
| Cost of revenue | $0.831 million | $0.716 million |
| Gross profit (loss) | profit of $0.642 million | loss of $0.561 million |
| Research and development | $15.702 million | $7.658 million |
| Sales, marketing, general and administrative | $9.211 million | $6.437 million |
| Total operating expenses | $24.853 million | $14.095 million |
| Loss from operations | loss of $24.211 million | loss of $14.656 million |
| Interest expense | $5.480 million | $2.170 million |
| Derivative liability revaluation | loss of $8.035 million | gain of $1.952 million |
| Warrant liability revaluation | gain of $0.891 million | gain of $0.803 million |
| Net loss | loss of $36.943 million | loss of $14.229 million |
| Net loss per share | $(1.66) | $(0.84) |
| Weighted-average shares | 22.296 million | 16.977 million |
| Adjusted EBITDA | loss of $18.823 million | loss of $11.182 million |
For the first half as a whole, revenue was $2.408 million against $0.744 million a year earlier, and the net loss widened from a loss of $43.008 million to a loss of $62.237 million.
Revenue: Roughly 9.5x, and $1.3 Million in Total
The headline number is correct: revenue grew roughly 9.5x. But the base was tiny. The move is from $0.155 million to $1.473 million, which is an addition of about $1.3 million in real money. The release attributes the increase to a combination of greater sensor shipment volume and development revenue. Development revenue is payment for engineering work done for a customer, not a repeat product sale, so this rate should not be read as though it runs forward on its own.
What did happen, and it is real: cost of revenue barely moved, $0.831 million against $0.716 million a year ago. When revenue rises and cost stands still, gross profit flips. From a gross loss of $0.561 million to a gross profit of $0.642 million. On the non-GAAP line, which adds back $25 thousand of inventory write-downs, adjusted gross profit was $0.667 million against a loss of $0.344 million a year ago.
And the other side has to be said too: at this revenue scale, one quarter's product mix or a modest inventory write-down could flip the line back. The positive margin is real, but it is not yet a trend.
Operating Expenses Grew, but Not Because the Business Grew
Total operating expenses jumped by $10.758 million, to $24.853 million. Research and development more than doubled, to $15.702 million.
The release says where it came from: primarily costs stemming from the acquisitions, along with integration and consolidation activities. Sitting inside the quarter are $1.143 million of acquisition-related costs ($2.870 million for the half), and the half also carries $1.139 million of restructuring charges. The cash flow statement shows $33.178 million paid for a business combination in the half, goodwill appeared on the balance sheet at $3.677 million, and intangible assets jumped to $13.684 million from just $32 thousand.
The practical conclusion: the year-over-year comparison is not a comparison of the same business. This quarter's cost structure includes acquired operations, so the jump in expenses cannot be read as organic growth of the same organization.
The Real Story Is in the Cash Balance
| 30 June 2026 | 31 December 2025 | |
|---|---|---|
| Cash and cash equivalents | $27.208 million | $32.363 million |
| Investment securities | 0 | $42.471 million |
| Total cash and investments | $27.208 million | $74.834 million |
| Shareholders' equity | $20.619 million | $55.548 million |
| Working capital | negative $16.138 million | positive $50.963 million |
| Notes payable, current | $24.559 million | $19.212 million |
| Derivative liability | $7.050 million | 0 |
This is the comparison the release itself draws, against year-end rather than against the year-ago quarter, and for liquidity it is the right one. In six months cash and investments fell by $47.626 million. The entire investment portfolio, $42.471 million, was liquidated to zero. What is left, $27.208 million, is cash only.
Against that stands full-year cash burn guidance of approximately $60 million. Even granting the company's full explanation of a more normal second half, the current balance is smaller than the annual burn the company itself is guiding to.
Working capital is the balance-sheet expression of the same fact. Current liabilities of $50.424 million exceed current assets of $34.286 million. A negative gap of roughly $16.1 million, against a positive gap of roughly $51.0 million at the end of 2025. I derived that by subtraction from the balance sheet in the exhibit; the release does not present a working capital line itself.
The cost of debt is climbing too. Quarterly interest expense more than doubled, to $5.480 million. The half contains $8.219 million of non-cash amortization of debt discount and issuance costs, plus a $3.083 million realized loss on debt extinguishment. Current notes payable rose to $24.559 million, and a $7.050 million derivative liability now sits on the balance sheet against zero at the end of 2025.
Why $68.4 million of access to capital is not $68.4 million in the treasury
The $68.4 million figure is not money the company has. The release says that as of 30 June MicroVision has access to $68.4 million of capital, subject to certain conditions, of which $41.2 million is under the existing ATM facility. Access is not a balance. The ATM component means selling shares into the market, which is future dilution of shareholders, not cash already in the treasury. When that number is presented next to the cash balance, it is easy to read $27.2 million and $68.4 million as one pool of liquidity. They are not. In the background, the weighted-average share count is already up 31.3%, to 22.296 million from 16.977 million, and additional paid-in capital rose to $1.0394 billion from $1.0121 billion in six months.
Part of the loss is a paper revaluation, and part of it is real burn
A large part of the large loss is not operational. The net loss includes a non-cash unrealized loss of $8.035 million on the derivative liability, against an unrealized gain of $1.952 million on the same line a year ago. That is a $9.987 million swing in a non-operating line, and it alone accounts for 44.0% of the $22.714 million increase in the net loss. This is fair-value revaluation: no cash came in, none went out, and there is no business content in it. Strip it out and the deterioration is roughly half as bad. And still there is no rescue here: adjusted EBITDA, which removes that same derivative loss along with $1.143 million of acquisition costs, $1.304 million of share-based compensation and $2.976 million of depreciation and amortization, still shows a loss that widened to $18.823 million from $11.182 million. The operating burn genuinely got worse.
The Reverse Split: Why the Per-Share Numbers Cannot Be Compared to Old Headlines
On 1 August 2026, a month after the quarter closed, a 1-for-15 reverse split became effective. Every 15 shares became one. The release presents the move under strengthening the company's capital markets position, and concedes explicitly that it also serves to support continued Nasdaq listing compliance.
What matters to the reader: the reported loss per share, $1.66 for the quarter against $0.84 a year ago, is shown for both periods after retroactive adjustment for the split. Any comparison to previously published MVIS per-share figures will be off by a factor of 15. This is not a change in the business, it is a different unit of measurement.
Guidance
The company gave no revenue, margin or earnings guidance. The only guidance in the release is on cash burn.
MicroVision improved full-year cash burn guidance to approximately $60 million, explaining it by expected normalization in the second half following non-recurring cash usage in the first half, alongside continued operational discipline and acquisition synergies. Improved is measured against a prior forecast, not against the ability to fund it. In practice, cash used in operations was $19.1 million in the quarter against $12.7 million a year ago, and $35.588 million for the half against $26.827 million.
The release also says the important part out loud: the company expects future financing activities to support continued execution of its strategic plan. In plain words, the funding for the plan is not sitting in the treasury today.
And what the company says about itself, quoting chief executive Glen DeVos verbatim: "Our Lidar 2.0 strategy is translating into meaningful commercial momentum and a path to near-term and future revenue." And elsewhere: "Our strategy is simple: deliver the right perception solutions at the right cost across multiple industries."
הזווית שלי
דעה אישית של אילן אברמוב - לא ייעוץ ולא המלצה
What I take from this report is that its important line is not revenue, it is cash. Cash and investments fell $47.6 million in six months, the investment portfolio was wound down to zero, and what remains is $27.2 million against annual burn guidance of roughly $60 million. Someone has to close that gap, and it usually gets closed with shares or with debt.
The revenue growth is real, but it needs proportion. Roughly 9.5x sounds like a change of state. In money it is an addition of about $1.3 million, and part of it is development revenue rather than repeat sales. When a small number grows, the percentages always look more dramatic than the dollars.
The swing to positive gross profit is a genuine milestone. Cost of revenue barely moved while revenue rose, which is exactly the leverage a company at this stage needs to show. But at this scale, one quarter does not prove a trend.
What I insist on doing with a report like this is separating revaluation noise from performance. The net loss looks far worse because of a derivative revaluation with no cash and no business in it, and that is about half the deterioration. And still, once you strip it out entirely, the adjusted EBITDA loss widened anyway. Both of those things are true at once, and both have to be said.
What I will watch next quarter: how much of revenue is repeat product rather than development work, whether gross margin stays positive, and how many shares were actually sold through the ATM. I am not an investment adviser, there is no recommendation here, and this is a report whose balance sheet demands closer monitoring than usual.


