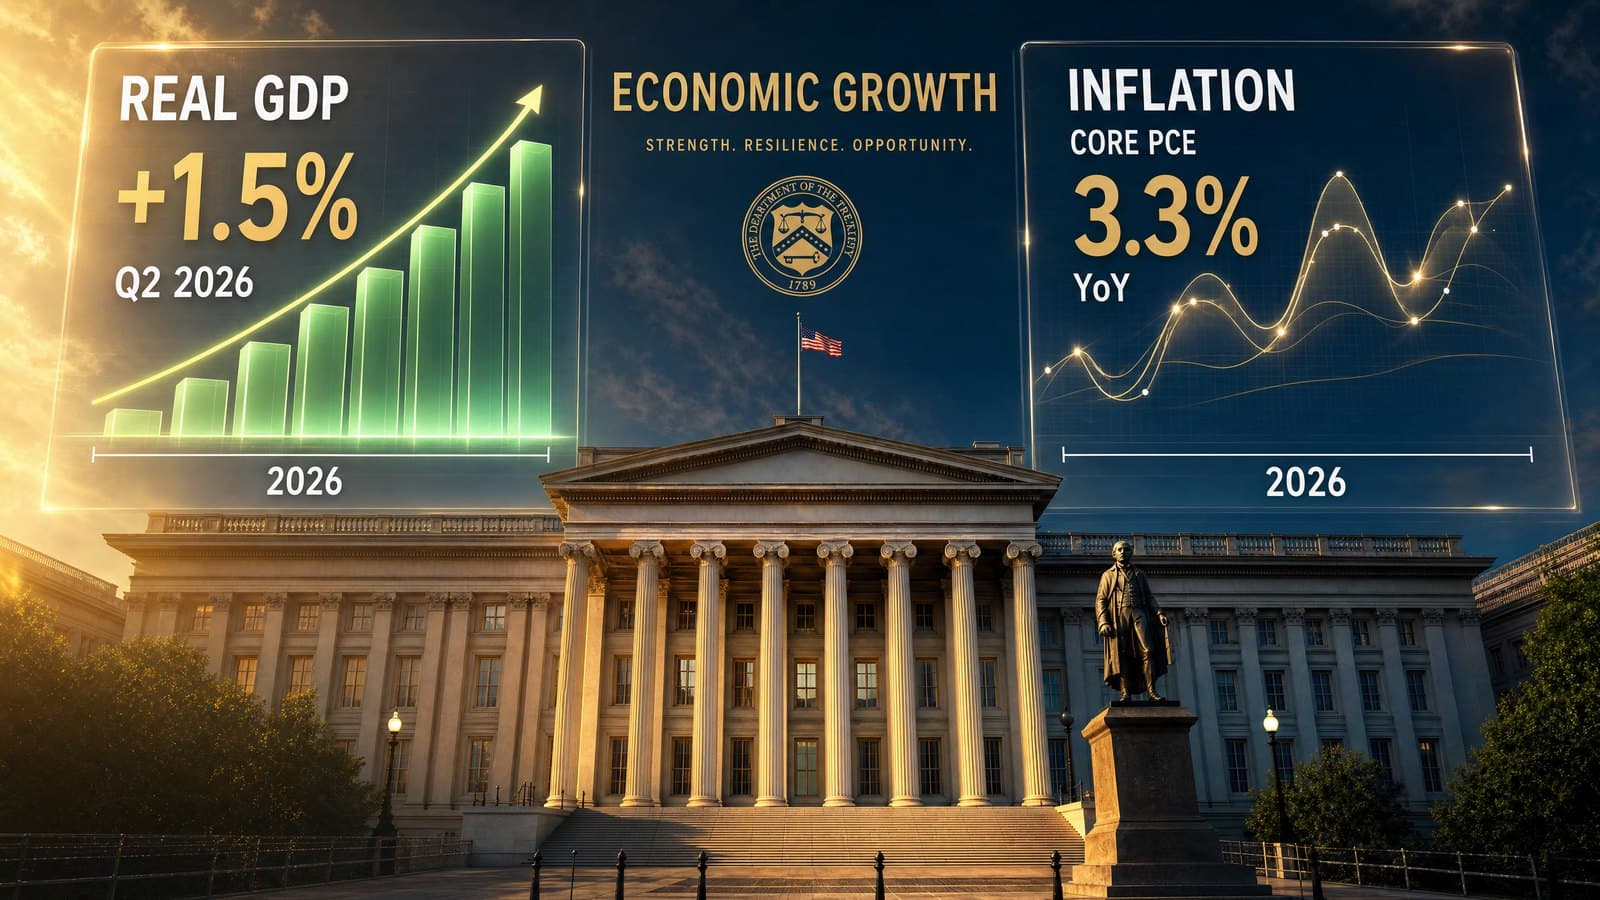
At half past three Israel time three data releases landed in Washington, and only one of them made headlines: the American economy grew just 1.5% in the second quarter, against 2.1% in the first.
That number is misleading, and the reason it is misleading is exactly what we have been writing about all week.
The First Release: GDP, and What Sits Beneath It
| Metric | Q2 2026 | Q1 2026 |
|---|---|---|
| Real GDP (annualized) | +1.5% | +2.1% |
| Real final sales to private domestic purchasers | +3.9% | +1.7% |
Look at the second row. It moved in the opposite direction from the first, and it is the more important of the two.
What 'final sales to private domestic purchasers' means, and why economists look at it first
GDP has four components: private consumption, investment, government spending, and exports less imports. And three of them can move for reasons unrelated to the strength of the economy:
- Trade - imports are subtracted from GDP. A month of heavy imports lowers the number, even when those imports are equipment that will generate future growth.
- Inventories - a company selling from stock rather than producing lowers GDP, without anything in demand having changed.
- Government - budget decisions and one-off events.
"Final sales to private domestic purchasers" strips out all three. What remains is private consumption and business investment - that is, what households and firms actually bought.
So when it moves from 1.7% to 3.9% while the headline falls, it says the internal engine of the economy accelerated - and the brake came from outside it.
And Where the Brake Came From - Three Items, One of Them Familiar
According to the release, the slowdown in the headline came from three places:
First - imports. The release states that imports increased, "primarily reflecting an increase in goods, led by capital goods."
And here is the point: the AI capex wave lowers GDP, it does not raise it
Capital goods means servers, processors, transformers, cooling equipment, electrical gear.
Which is precisely what every report this week described from the other side: Microsoft with roughly $190 billion of annual capex, Meta with $31 billion in a quarter, and Quanta with a $53.4 billion backlog.
Much of that equipment is manufactured abroad. And when it enters the United States it is recorded as an import - and subtracted from GDP.
Meaning: the faster the AI capex wave runs, the more it lowers reported GDP in the short term, even as it raises future productive capacity. The number that looks like a slowdown is partly the exact opposite.
This is not a trick and not a distortion - it is how GDP is calculated. But it is why you do not read the headline alone.
Second - inventories. Private inventory investment declined, with wholesale trade the largest contributor. Selling from stock lowers GDP without changing demand.
And third - government, and this one is a one-off. Government spending fell, "primarily reflecting nondefense consumption expenditures" - and the release states explicitly that the cause is sales of crude oil from the Strategic Petroleum Reserve. Selling oil from the reserve is recorded as negative government consumption. That is an accounting entry, not a cut to services.
The Second Release: Inflation - and the Split the Fed Described a Day Earlier
Here we connect directly to yesterday's rate decision.
At the quarterly level:
| Metric | Q2 | Q1 |
|---|---|---|
| PCE price index | +5.1% | +4.6% |
| Core PCE (excluding food and energy) | +3.4% | +4.4% |
| Gross domestic purchases price index | +5.7% | - |
The headline accelerated. The core fell. And the gap between them is food and energy.
And in the monthly June figures, released at the same hour:
| Metric | Monthly | Year-over-year |
|---|---|---|
| Headline PCE | -0.1% | +3.7% |
| Core PCE | +0.1% | +3.3% |
Why this is exactly what the Fed said yesterday - and the data confirmed it
Yesterday's FOMC statement said inflation remains above target "in part reflecting supply shocks that have raised prices in some sectors, including energy."
And today's data is precisely that, in numbers: a headline index accelerating to 5.1% in the quarter while core falls to 3.4%. When the headline rises and the core falls, the difference is food and energy almost by definition.
Which is why both camps on the committee drew ammunition from the same release:
The majority, which held rates, looks at core at 3.3% year-over-year and 0.1% on the month - a clear moderating trend. Interest rates do not produce barrels of oil, so there is no point tightening into a supply shock.
The three dissenters, who wanted a hike, look at 5.1% in the quarter and 3.7% year-over-year on the headline - and at inflation running above target for more than five years. At some point the source matters less than the duration.
The Third Release: the Labour Market - and Why It Closes the Door
Initial jobless claims for the week ended July 25 came in at 197,000, up 9,000 from the prior week and below the roughly 200,000 forecast. Continuing claims fell 7,000 to 1.782 million for the week ended July 18.
197,000 is historically low. And why that matters right now:
The Fed has a dual mandate - price stability and full employment. When inflation is high but the labour market weakens, there is a justification for cutting. When the labour market is tight, that justification disappears.
Meaning: this release closes the last door to a near-term cut.
And the Figure Almost Nobody Discusses: the Saving Rate
2.7%.
In June personal income rose 0.2% and personal spending rose 0.3%. The consumer spent more than they earned - and the saving rate fell to 2.7% of disposable income.
Why this is the fragile number in the whole set
A 2.7% saving rate is very low by historical comparison.
The implication: private consumption - roughly two-thirds of GDP - is currently funded out of current income with almost no cushion.
And that works fine as long as the labour market is strong. 197,000 claims says it is.
But it also means there is no margin. A consumer saving 2.7% responds to a shock - a job loss, a jump in fuel prices, a mortgage reset - immediately, not in three months.
This is not a prophecy. It is a measurement of how fragile the base under that 3.9% growth is.
The Full Picture: What the Three Releases Say Together
Put them side by side and you get a consistent, uncomfortable picture:
| Finding | Meaning |
|---|---|
| Private demand accelerating to 3.9% | The economy is stronger than the headline shows |
| Capital-goods imports lowering GDP | The AI wave distorts the measurement downward |
| Core inflation falling to 3.3% | The right direction - support for the majority that held |
| Headline accelerating to 5.1% in the quarter | Energy - support for the three dissenters |
| Jobless claims at 197,000 | No employment case for a cut |
| A saving rate of 2.7% | The consumer has no cushion |
The conclusion: there is nothing here that justifies a rate cut, and several things that explain why three committee members asked for a hike.
What This Means for Rates - Three Questions, One Answer
The Fed has a relatively simple reaction function. Let us run the three releases through it one at a time.
Question 1: Is growth cooling enough to justify a cut?
This was the strongest argument the easing camp had - until this morning.
GDP of 1.5%, against 2.1%, is exactly the number a dove would point at and say "the economy is slowing, it is time to ease."
And the 3.9% figure on final sales to private domestic purchasers erases that argument. The Fed reads the breakdown exactly as we do, and it knows the headline slowdown originates in imports, inventories and a reserve oil sale - not in households and firms buying less.
The opposite is true: they are buying more, at double the prior quarter's pace.
Question 2: Has the labour market weakened enough?
197,000 initial claims, and continuing claims falling.
That is the shortest answer in the whole set: no. The Fed's employment mandate provides no grounds for easing. And this is the side that closes the door - because even with high inflation, a central bank can justify a cut if the labour market is coming apart. It is not coming apart.
Question 3: Is inflation on its way to target?
And here, and only here, there is a genuine argument for the less restrictive side.
Core PCE rose 0.1% in June. Annualized, a monthly pace like that is roughly 1.2% - below the 2% target. And the headline index actually fell 0.1% that month.
Which is why the quarterly and monthly figures must be separated - they describe different things
The quarterly figure (5.1% headline, 3.4% core) is an average of April, May and June. It looks backward across three months.
The monthly figure (-0.1% headline, +0.1% core) is June alone - the freshest read.
And the gap between them tells a story: there was a price shock inside the quarter
- most likely energy - and it had already faded by June.
Whoever reads only the quarterly sees acceleration. Whoever reads only the monthly sees calm. Both are correct, and they are simply measuring different periods.
The caveat: one month is not a trend. The annual level is still 3.7% headline and 3.3% core - well above the 2% target.
The Combined Answer
| The test | The finding | The direction |
|---|---|---|
| Growth | Private demand +3.9%, accelerating | Against a cut |
| Employment | 197,000 claims, low | Against a cut |
| Inflation - level | 3.7% / 3.3% annual | Against a cut |
| Inflation - monthly direction | Core +0.1% in June | For patience |
Three of four rule out a cut. The fourth supports waiting, not easing.
The practical conclusion: the likely scenario is neither a cut nor a hike - it is an extended hold. What changed today is the asymmetry: after this data, the probability of a hike is higher than the probability of a cut. Which is precisely why yesterday's vote was 9-3 and not unanimous.
Today's data, published 22 hours after the vote, supported the dissenters - not the majority.
And the Question That Really Matters: Good or Bad for Markets?
Here the answer is not "mixed." It splits by asset type, and the split is sharp.
Bad for anything priced off interest rates
Utilities, income real estate, regulated infrastructure - anyone whose revenue is predictable and backed by long contracts - is priced like a bond. The longer rates stay high, the more their multiple is compressed.
And this already happened yesterday, in front of us: on the day Microsoft confirmed record demand, Trane fell 4.94%, EMCOR 4.72%, Quanta 4.63% and seven utilities - all negative.
Today's data confirms that trend continues. There is no relief on the horizon.
And long-duration growth stocks - those whose profits sit a decade out - suffer for exactly the same reason: high rates discount the future more severely.
And good - genuinely good - for the corporate top line
Private demand growing 3.9% in real terms, plus inflation of roughly 3%, is a nominal environment of about 7%.
And that is an excellent environment for revenue. A company selling to an American consumer or business is operating in a market growing at that rate - which is exactly what today's reports showed: Quanta +41%, EMCOR +19.8%, Mastercard +14%, Trane with bookings +39%.
There is no recession here and no demand slowdown. There is a strong nominal economy.
Which brings the bottom line, and this is the most precise way I can put it:
This data is good for earnings and bad for multiples.
Earnings will grow because the demand is there. Multiples will be pressed because rates are not falling. What determines market direction is which of the two moves more - and that cannot be known in advance.
But you can know who benefits and who suffers from this mix: companies with near-term profit, pricing power and a strong balance sheet benefit. Companies whose value sits in the distant future, or whose revenue is priced like a bond, suffer.
And the real risk - which is not inflation
Everyone is watching the price indices. The number that could actually break this market is a different one.
The saving rate stands at 2.7%. Private consumption is roughly two-thirds of GDP, and it is funded almost entirely out of current income.
Meaning: that 3.9% growth rests on a single pillar - employment.
As long as claims run at 197,000 a week, the pillar holds. But in a consumer saving 2.7%, there is no lag between losing a job and cutting spending. There is no cushion that absorbs two months.
So: the weekly number worth following is not the PCE. It is jobless claims. Inflation will determine what the Fed does; employment will determine whether there is anything left to defend.
My Angle
A personal opinion of Ilan Abramov - not advice, not a recommendation
What catches me in these three releases is that the headline and the reality went in opposite directions, and the explanation sits precisely in the story we have been covering all week.
"GDP slowed to 1.5%" sounds like a slowdown. But private demand doubled its pace - from 1.7% to 3.9% - and part of the brake came from imports of capital goods.
And there is something almost funny about that: the same capex wave we saw in this week's reports - Microsoft, Meta, Quanta, EMCOR - is recorded in the national accounts as a minus. Because the equipment is imported, and imports are subtracted from GDP. The economy is building a decade of productive capacity, and the quarterly measurement penalises it for that.
That is not a problem with the data - it is how GDP is defined. It is a problem with reading the headline alone.
And the part I find most important is the inflation split. A headline index accelerating to 5.1% while core falls to 3.4% is the definition of supply-driven inflation. And that is exactly what the Fed wrote in its statement yesterday - 22 hours before the data was published. You do not often see a central bank articulate a diagnosis and have the data arrive the next day and confirm it.
And what I hold as the fragile point: 2.7% saving. That 3.9% growth rests on a consumer spending almost everything they earn. As long as there are jobs - and at 197,000 claims there are - it holds. But it explains why the labour market has become the only variable that truly matters: not because of employment itself, but because there is no cushion behind it.
And what I will watch: the gap between headline and core. Right now 3.7% against 3.3% annually. If the gap closes from above - the headline falling toward core - it means the energy shock is passing, and the committee's argument ends in the majority's favour. If core starts climbing toward the headline, that is inflation that has spread - and then the three dissenters become the majority.
And on markets, I try to be careful with the simple answer. "Strong data equals good for stocks" is true only in an environment where rates do not react. Here they react.
What I am comfortable saying: this is an environment that rewards near-term profit and punishes distant promise. A company earning today, with pricing power and a balance sheet, operates in a nominal market growing about 7%. A company whose value sits a decade out is discounted at a rate that is not falling. This is not a "good" or "bad" market - it is a market that separates the two sharply.
Summary
Three releases landed this morning, and the headline of one obscured the other two.
GDP grew 1.5% against 2.1% - but real final sales to private domestic purchasers jumped to 3.9% from 1.7%. The brake came from imports led by capital goods, from inventories, and from a strategic petroleum reserve sale.
Inflation split: the headline PCE index accelerated to 5.1% in the quarter while core fell to 3.4%. In June the headline actually fell 0.1% and core rose 0.1%; year-over-year - 3.7% against 3.3%.
And the labour market stayed tight: 197,000 initial claims, and continuing claims down to 1.782 million. And the saving rate - just 2.7%.
The question for the investor is not whether the economy is slowing - private demand actually accelerated. The question is whether above-target inflation is a passing supply shock or a trend that has settled in. Core PCE says the former. The headline still says the latter. And between those two readings runs the 9-3 vote.
Sources: the U.S. Bureau of Economic Analysis release on GDP for the second quarter of 2026 - advance estimate, published July 30, 2026, including the real growth rate, real final sales to private domestic purchasers, the price indices and the detail of contributions and subtractions; the BEA release on Personal Income and Outlays for June 2026 of the same date, including income, spending, the PCE price index and core, and the saving rate. Jobless claims figures are from the U.S. Department of Labor release for the week ended July 25, 2026 as reported in economic coverage - the department's site was not reachable for direct retrieval at the time of writing, so they are presented as reporting rather than as a quotation from the primary source. The FOMC statement is from July 29, 2026. Data accurate as of the time of writing. Nothing herein constitutes a forecast, recommendation or advice - see the full disclaimer at the bottom of the page.


