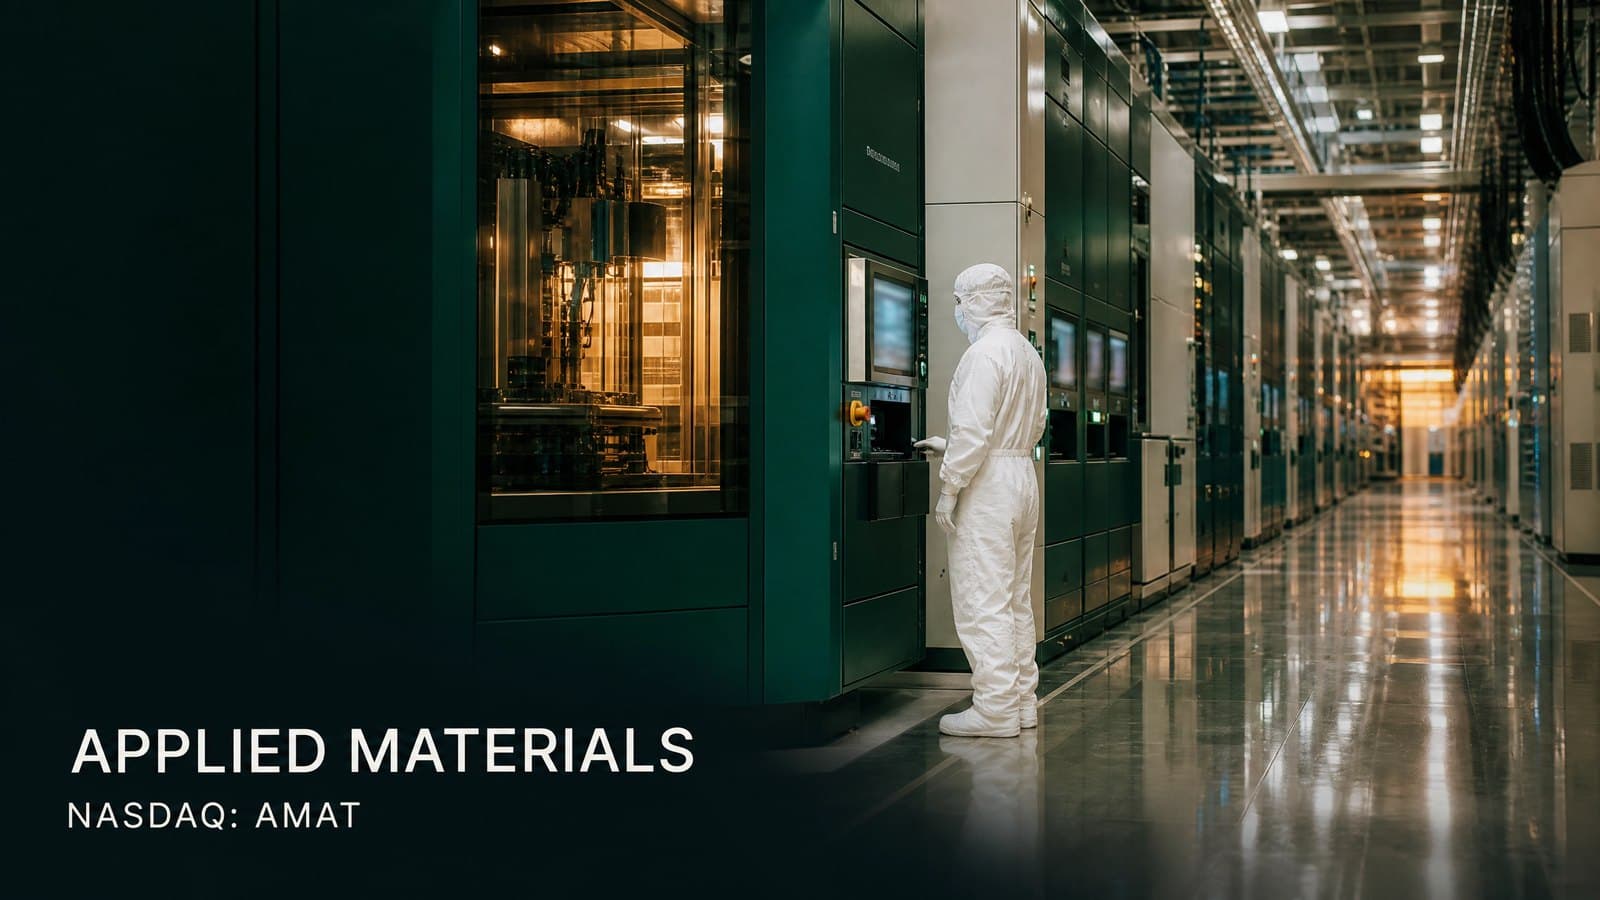
Applied Materials reported its fiscal third quarter, ended 26 July 2026, on 13 August. We are writing about it today.
Errors or inaccuracies are possible. Spotted something that looks wrong? Write to me and I will correct it.
What the Company Does
Applied Materials sells the machines that chips are made on. It does not manufacture chips itself - it supplies the deposition, etch, measurement and inspection equipment that manufacturers such as TSMC, Samsung and Intel install in their fabs. This is a capital equipment model: its revenue is derived from the capital spending of chipmakers, rather than directly from sales of the chips themselves.
The Quarter
| The quarter | A year ago | |
|---|---|---|
| Revenue | $9.115 billion | $7.302 billion |
| Change | 25% | |
| Gross margin | 50.3% | 48.8% |
| Operating margin | 33.7% | 30.6% |
| Operating income | $3.08 billion | |
| Net income | $2.538 billion | $1.779 billion |
| Diluted earnings per share | $3.17 | $2.22 |
| Non-GAAP gross margin | 50.4% | 48.9% |
| Non-GAAP operating margin | 34.0% | 30.7% |
| Non-GAAP net income | $2.795 billion | $1.989 billion |
| Non-GAAP earnings per share | $3.50 | $2.48 |
| Non-GAAP free cash flow | $2.330 billion | $2.050 billion |
The Segments, and That Is Where the Story Is
| $ millions | The quarter | A year ago |
|---|---|---|
| Semiconductor Systems revenue | 7,040 | 5,564 |
| Semiconductor Systems gross margin | 55.3% | 53.4% |
| Semiconductor Systems operating income | 2,657 | 1,837 |
| Semiconductor Systems operating margin | 37.7% | 33.0% |
| Applied Global Services revenue | 1,781 | 1,463 |
| Applied Global Services operating income | 536 | 400 |
| Other revenue | 294 | 275 |
| Other operating loss | 118 | 4 |
Semiconductor Systems grew 27%, but its operating income grew 45%. The segment's operating margin rose from 33.0% to 37.7%, almost five percentage points. This is operating leverage in its clean form: the same infrastructure producing more sales at a lower marginal cost.
What Sits Inside the Segment
The company also reports the customer mix within Semiconductor Systems:
| Share of segment revenue | The quarter | A year ago |
|---|---|---|
| Foundry, logic and other | 67% | 69% |
| DRAM | 26% | 22% |
| Flash memory | 7% | 9% |
Those weights tell a story the headline number hides. On the basis of the segment's reported revenue, DRAM rose from about $1.22 billion to about $1.83 billion - growth of roughly 50%. Over the same period flash fell from about $501 million to about $493 million, which is to say it stood still.
A note on that calculation: the weights are reported as rounded percentages, so the amounts I derived from them are an approximation and not a reported figure. The company does not publish the precise financial breakdown, which is why each carries an "about".
The direction itself does not depend on the rounding: DRAM's share rose four percentage points and flash fell two, inside a segment that grew 27%.
And this is consistent with what the company says itself: CFO Brice Hill notes an expectation of continued strong growth in the second half of the calendar year, "particularly in DRAM as well as leading-edge foundry-logic and advanced packaging". High bandwidth memory, which artificial intelligence accelerators require, is built on DRAM.
The Margin, and the Streak Behind It
Gross margin stood at 50.3% against 48.8% a year ago. According to the company, this is the thirteenth consecutive quarter in which gross margin expanded against the year-earlier quarter.
A streak like that is not the result of one strong quarter. It says that product mix or pricing power has changed in a sustained way. Hill attributes it to "the increasing value we create by enabling better chips, systems and fab returns".
And Where the 43% Actually Came From
This is the point that requires reading the table rather than the headline. Net income rose 43%, but pre-tax income rose only 13%.
| $ millions | The quarter | A year ago | Change |
|---|---|---|---|
| Operating income | 3,075 | 2,233 | 38% |
| Other income and expense, net | -100 | 396 | |
| Pre-tax income | 2,907 | 2,563 | 13% |
| Provision for income taxes | 369 | 784 | |
| Net income | 2,538 | 1,779 | 43% |
Two movements below the operating line did the work, and each deserves separate treatment.
The first works against: other income and expense swung from a gain of $396 million to an expense of $100 million. That is a headwind of $496 million, and it is why pre-tax income grew only 13% while operating income grew 38%.
The second works in favour, and more strongly: the tax provision fell from $784 million to $369 million - on higher pre-tax income. The effective tax rate fell from 30.6% to 12.7%.
What this means in practice: operating income, which is the business performance, grew 38%. That is the figure reflecting what happened in manufacturing and sales.
Earnings per share grew 43% - slightly more - but by an entirely different route: a large headwind in the financial line, and a larger offset from the tax rate.
The company does not explain the drop in the tax rate in the release, so the cause is not known. What can be said: a 12.7% tax rate is not a level one can assume returns automatically every quarter, and anyone deriving a future earnings run-rate from this line is taking on that assumption.
And it appears in the guidance too: the company notes explicitly that next quarter's non-GAAP earnings per share guidance includes a net income tax benefit of $0.05 per share relating to intra-entity intangible asset transfers.
Guidance
| Fiscal fourth quarter 2026 | |
|---|---|
| Revenue | $10.25 billion, plus or minus $500 million |
| Non-GAAP earnings per share | $4.02, plus or minus $0.20 |
The midpoint of the guidance is 12.5% growth over this quarter - itself a record quarter. In non-GAAP earnings per share terms, from $3.50 to $4.02, that is an increase of about 15%.
What the company says beyond the quarter: CEO Gary Dickerson notes that the company is raising its revenue expectations for Semiconductor Systems for calendar 2026, and expects to grow faster than the market this year. On 2027, his language is an expectation of "another strong growth year", on the basis of what he describes as greater visibility of demand from customers.
And Hill adds that the company is making additional manufacturing capacity investments to support projected demand through the end of the decade.
And what is less comfortable in the report: the "Other" segment, which includes the display business, moved from an operating loss of $4 million to a loss of $118 million - on revenue that barely moved, $294 million against $275 million.
That difference, $114 million, was easily absorbed by Semiconductor Systems this quarter. But it is a segment that went from breakeven to deficit within a year, and the release does not detail what caused it.
And What Was Returned to Shareholders
Record cash from operations of $3.04 billion, of which $860 million was returned to shareholders: $440 million in share repurchases and $420 million in dividends.
That is about a third of the cash flow. The rest stayed in the company, and the release explicitly notes additional investments in manufacturing capacity.
הזווית שלי
דעה אישית של אילן אברמוב - לא ייעוץ ולא המלצה
I see this report as one of the cleanest gauges of the artificial intelligence investment cycle, precisely because Applied does not sell chips. It sells the machines bought when someone decides to build. Its revenue is the capital decisions of manufacturers rather than end demand, which means it arrives earlier in the chain.
And the line I look at is the margin, not the revenue. Twenty-five percent growth in a year when everyone is buying equipment is an expected number. A thirteenth consecutive quarter of gross margin expansion is something else - it says that even as volumes grow, the company is not forced to cut price. In an equipment market with few suppliers and few substitutes, that is exactly what we would expect to see if the pricing power is real.
And so I read this quarter through operating income rather than through earnings per share. Thirty-eight percent growth in operating income is a business achievement. Forty-three percent in earnings per share is that same achievement plus a 12.7% tax rate that nobody promised would return. Anyone modelling 2027 off this quarter's bottom line is modelling a tax assumption inside it.
What I would check next quarter: whether DRAM's share keeps rising. If it passes 30%, that is no longer a shifting mix but a structural change in the company's customer base, and it connects directly to the high bandwidth memory going into accelerators. And conversely, a display segment that fell to a $118 million operating loss is a small line that becomes a loud one if it repeats.
And the caution built into this business: a capital equipment supplier lives on investment cycles. It feels the upturn first, and it feels the downturn first too. Guidance of $10.25 billion for the quarter says customers are still building - it does not say when they will stop.
(An important note: this is my personal opinion only, and nothing here is a recommendation to take any action.)


