Some reports cannot be read from the top line alone. Enphase Energy (NASDAQ: ENPH) reported revenue down nearly 20% versus the comparable quarter - and in that same quarter also expanded its margin and returned operating profit to positive.
And to understand why, you need to know one term.
About the Company
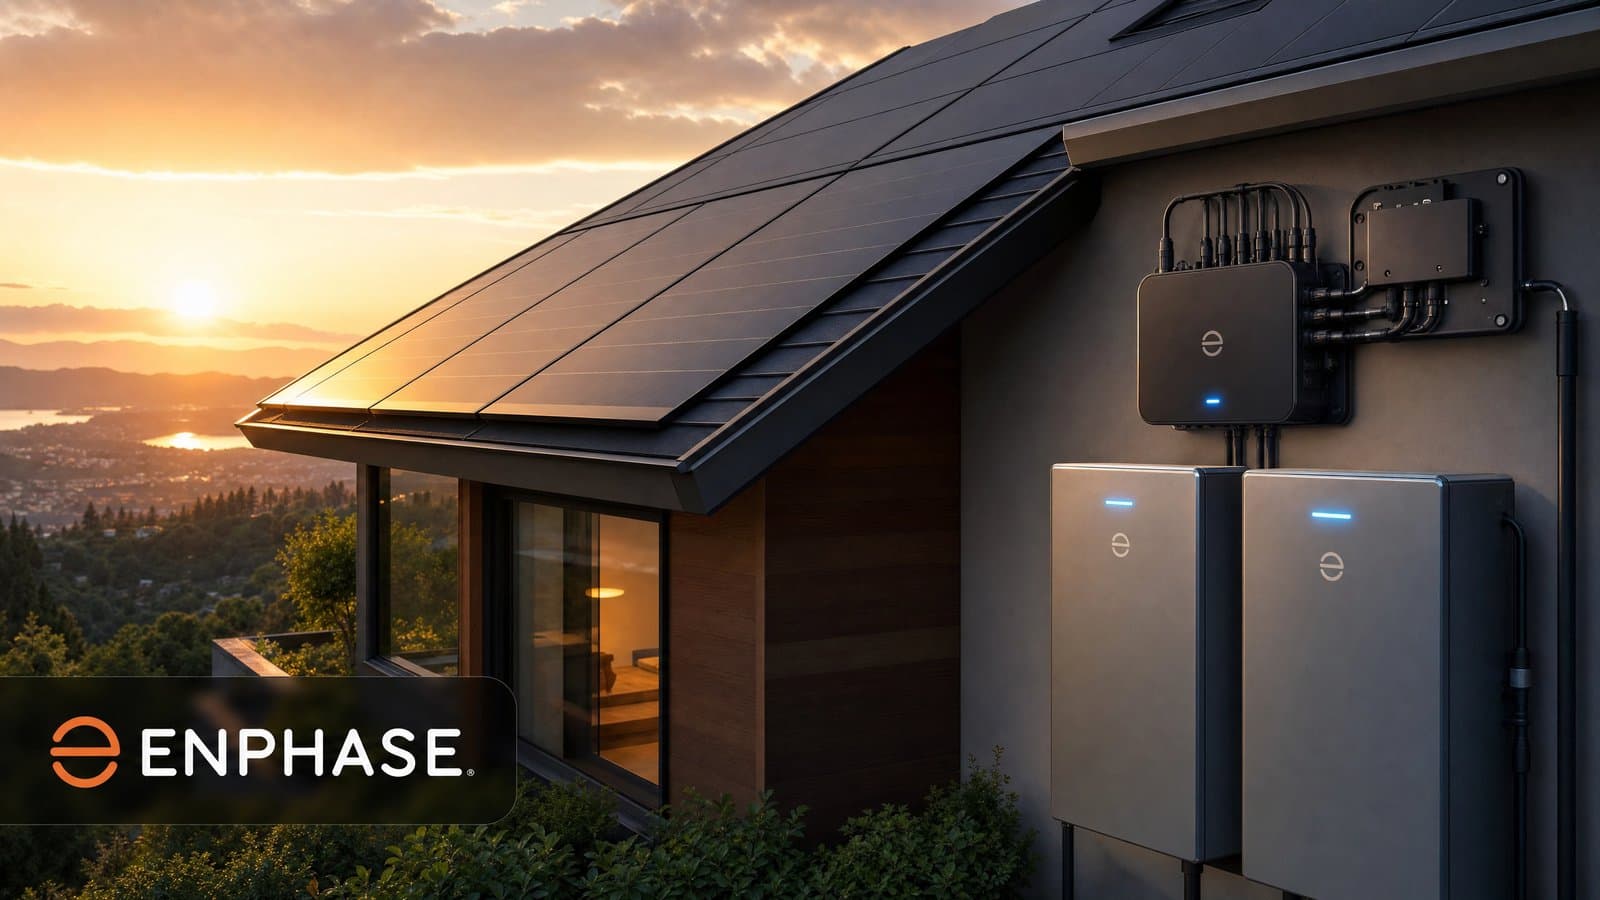
Enphase makes microinverters - the component that converts the direct current a solar panel produces into the alternating current a home can use.
And the difference from competitors is architectural. In the traditional approach, all the panels on a roof connect to one central inverter. The problem: if one panel is shaded or dirty, it drags the whole system down. Enphase places a small unit under each panel separately - so every panel works independently, and faults stay isolated.
Alongside this the company sells home storage batteries and energy management systems. This quarter it shipped about 1.59 million microinverters (725.2 megawatts) and 113.8 megawatt-hours of batteries.
The Sector: What Happened to Solar Over the Past Three Years
Before getting into the numbers, the context is worth understanding - because this is a report from a company in an industry that collapsed, and is only now lifting its head.
Who the Players Actually Are
"Solar" is not one industry but a chain of entirely different roles:
- Panel manufacturers - the modules that capture the light. This is the part that became a commodity: Chinese competition drove prices down dramatically, and margins eroded.
- Inverter makers - the component that converts the electricity into usable form. This is where Enphase and SolarEdge sit, and both sell technology rather than a passive module.
- Installers - companies like Sunrun, which sell and install home systems, and sometimes finance them through leases.
- Utility-scale projects - solar farms for power companies, an entirely different world in terms of customers and financing.
Enphase and SolarEdge are direct competitors in the home inverter layer, and both solved the same problem two ways: Enphase with a microinverter per panel, SolarEdge with an "optimizer" per panel connecting to a central inverter.
Why the Sector Collapsed
Three causes that worked together
First, interest rates. This is the central cause, and it is not intuitive. A home solar system is almost always bought with financing - the customer does not pay tens of thousands of dollars in cash. And when rates rise, the monthly payment rises - and at some point it is no longer lower than the electricity bill. Once the saving disappears, the product stops selling. Second, inventory glut. During the boom, installers ordered equipment in enormous quantities. When demand stopped, the warehouses stayed full - and manufacturers stopped selling not because end demand vanished, but because their customers were already holding stock. And third, regulatory and subsidy changes. Credit and pricing rules changed in key states, and every such change freezes purchase decisions until it clarifies.
The result was sharp: SolarEdge stock lost about 90% from its peak during 2023-2024, and the whole sector entered an extended period of losses, layoffs and inventory reduction.
And What Happened in 2026
The stocks recovered sharply. Since the start of 2026, Enphase has risen about 54% and SolarEdge about 88%. The sector returned to investors' radar.
But - and this is the important point - the volumes have not.
Industry forecasts point to a decline in U.S. residential solar installations in 2026 versus 2025: Sunrun expects a drop of about 25%, Enphase about 22%, and SolarEdge about 20%.
The distinction worth holding
A stock up 54% and an industry contracting 22% are not a contradiction. They describe two different things: the stock is pricing the distance from the bottom, and the volumes describe the situation on the ground. After a 90% collapse, even a partial recovery produces a large return. The question is whether the recovery in the stock is running ahead of a real improvement - or pricing it in advance.
So Why Does Enphase Matter at All
Three reasons, each deserving a caveat:
First, it is in the right layer. A panel maker competes against China on price. An inverter maker sells electronics and software - a market with fewer players and higher margins. Enphase's adjusted gross margin, nearly 47%, would not be possible in module manufacturing.
Second, storage. The home solar story has shifted in recent years from "generate electricity" to "generate and store". A home battery lets you consume in the evening what was produced during the day - and that is what makes the system worthwhile when electricity tariffs vary by hour. Enphase sells both parts.
And third, domestic manufacturing. In a world of tariffs, a company producing in Texas and South Carolina is in a different position from one importing everything.
And the caveat: none of these reasons makes the industry a growing one. They only determine who suffers less in an industry that is contracting.
The Term That Explains the Report: "Safe Harbor" Revenue
This is the point without which the report misleads.
In the United States, a solar installation entitles the owner to a tax credit. But eligibility rules change, and sometimes there is an expiration date. And this is where a mechanism called safe harbor comes in: whoever buys equipment or begins work by a certain date locks in eligibility for the credit, even if the project itself is completed later.
The practical meaning: customers order equipment earlier than needed, purely to meet the condition. That produces a concentrated wave of orders.
| Metric | Current quarter | Prior quarter |
|---|---|---|
| Safe harbor revenue | $84.3 million | $34.5 million |
In other words: about 29% of the quarter's revenue came from pull-forward buying. And over the half year, the company signed agreements with third parties totaling about $1.08 billion - $202.4 million under the 5% route, and $878.6 million under the "physical work test."
Why this is a yellow light, not a green one
Revenue from pull-forward buying is real revenue - the money came in and the equipment shipped. But it is borrowed from the future, not added to it. A customer who bought today to lock in a credit will not buy that same unit again next year. So you always have to ask: what is left without it? This quarter, revenue excluding the safe harbor component is about $207.6 million, against about $248.4 million in the prior quarter. The core is contracting, even as the top line rises.
What Was Reported
| Metric | Q2 2026 | Q1 2026 | Q2 2025 |
|---|---|---|---|
| Revenue | $291.9 million | $282.9 million | $363.2 million |
| GAAP gross margin | 60.0% | 35.5% | 46.9% |
| Adjusted gross margin | 46.8% | 43.9% | 48.6% |
| GAAP operating income | $51.5 million | $(29.6) million | $37.0 million |
| Adjusted operating income | $56.7 million | $47.3 million | $98.6 million |
| GAAP net income | $36.1 million | $(7.4) million | $37.1 million |
| GAAP diluted EPS | $0.27 | $(0.06) | $0.28 |
| Adjusted diluted EPS | $0.46 | $0.47 | $0.69 |
And here are two distinctions worth making:
First, the comparison depends on what you compare to. Against the prior quarter - this is a clear improvement: from a $29.6 million operating loss to $51.5 million of profit. Against a year ago - it is a retreat: revenue fell 20%, and adjusted EPS fell from $0.69 to $0.46.
Second, GAAP gross margin is higher than adjusted - 60.0% against 46.8%. That is the reverse of the usual situation, and it typically stems from domestic manufacturing tax credits recorded in cost of goods sold under GAAP. In such a case, the adjusted figure is the more representative one for the economics of the product.
The Geographic Breakdown - and It Tells a Story
| Market | Change |
|---|---|
| United States | -3% |
| Europe | +35% |
This may be the most interesting figure in the report. The U.S. market - the company's home, and the source of the safe harbor component - is contracting. Europe, by contrast, is growing at a high double-digit rate.
And the explanation is plausible: high electricity prices in Europe, alongside supportive regulation, make home storage more worthwhile. In the U.S., by contrast, uncertainty around tax credits creates exactly the behavior we saw - early buying and then quiet.
Tariffs
A point worth noting: reciprocal tariffs cost about 2.0 percentage points of gross margin this quarter - against about 4.3 points in the prior quarter.
In other words, the impact roughly halved. The company noted it shipped 1.58 million units from its facilities in Texas and South Carolina - meaning domestic manufacturing reduces the exposure. This is a concrete example of how a company responds to tariffs in practice.
Guidance
| Metric | Third-quarter guidance |
|---|---|
| Revenue | $290.0-320.0 million |
| Of which, safe harbor | about $75.0 million |
| Batteries | 130-150 megawatt-hours |
| GAAP gross margin | 42.0%-45.0% |
And again, the important figure is buried inside: the guidance includes about $75 million of safe harbor revenue - less than the $84.3 million of the current quarter. In other words, management itself is signaling this wave is beginning to moderate.
The Bull Thesis
Whoever reads it positively will point to the sequential improvement: from a $29.6 million operating loss to $51.5 million of profit, and an adjusted margin expanding from 43.9% to 46.8% - and that while tariffs are still costing 2 points.
Beyond that: Europe growing 35% provides an engine not dependent on U.S. regulation. The balance sheet is strong with $937.7 million in cash and securities. And $1.08 billion of signed agreements provides some forward visibility.
The Bear Thesis
Whoever reads it critically will note first the decline versus a year ago: revenue down 20% and adjusted EPS down a third - from $0.69 to $0.46.
Second, the quality of the revenue. Almost 29% of the quarter came from pull-forward buying. Excluding it, the core is contracting - and management itself guides to a smaller component next quarter.
Third, the U.S. market is shrinking. A 3% decline in the home market, while a wave of early buying is simultaneously underway, hints at weaker underlying demand.
And fourth, regulatory dependence. A business whose demand is influenced to this degree by tax-credit expiration dates is hard to forecast, and exposed to policy change.
The debate in one line
The bulls see operating profit flipping from a loss, a margin expanding despite tariffs, Europe growing 35% and a $938 million balance sheet. The bears see revenue down 20% year-over-year, nearly a third of the quarter coming from pull-forward buying that will not repeat, a contracting U.S. market and high regulatory dependence. Both sides are reading the same report.
My Angle
A personal opinion of Ilan Abramov - not advice, not a recommendation
This report is a good reminder that not every dollar of revenue is born equal.
$291.9 million is one number. But $84.3 million of it came from customers who bought early to lock in a tax credit. That is real money, and it came in - but it was borrowed from future quarters, not created.
And that is exactly the sort of thing easy to miss on a quick read. The headline says "revenue rose versus the prior quarter." The content says the safe harbor component nearly doubled - from $34.5 million to $84.3 million. Without it, the quarter would have contracted.
And what I find interesting on the positive side is the geographic breakdown. U.S. minus 3%, Europe plus 35%. That suggests the genuine demand - the kind not driven by a race against a regulatory calendar - is actually across the ocean. And that is a better long-term argument than a domestic wave of orders.
And what I will follow: revenue excluding safe harbor. Management is already guiding to $75 million next quarter instead of $84. The day that component goes to zero, we will see the real demand without makeup. That will be the true test of this business, and it is coming.
Summary
Enphase delivered a quarter that requires careful reading. Versus the prior quarter: a clear improvement - operating profit flipped from a $29.6 million loss to $51.5 million of profit, and the adjusted margin expanded to 46.8%. Versus a year ago: a retreat - revenue fell about 20% to $291.9 million, and adjusted EPS fell from $0.69 to $0.46.
And the figure that governs the reading: about $84.3 million of revenue was safe harbor revenue - pull-forward buying to lock in a tax credit - against $34.5 million in the prior quarter. Next quarter's guidance includes only about $75 million of it.
The question for the investor is not whether the quarter was good or bad - it was both, depending on the comparison point. The question is what remains once the pull-forward wave ends, and how much of the growth in Europe can offset a contracting U.S. market.
Sources: Enphase Energy's official results announcement for the second quarter of 2026 (July 28, 2026), as filed with the U.S. Securities and Exchange Commission on Form 8-K, including revenue and its geographic breakdown, safe harbor revenue, GAAP and adjusted margins, operating and net income, earnings per share, shipments, the tariff impact, cash balances and third-quarter guidance; sector stock performance and 2026 U.S. residential installation forecasts as covered in the financial press, including Investing.com and Yahoo Finance. Stock performance figures fluctuate and are accurate as of the date of that coverage. Data accurate as of the time of writing. The chart is shown in real time via TradingView. Nothing herein constitutes a forecast, recommendation or advice - see the full disclaimer at the bottom of the page.


